So as a thought experiment, I moved four of the top hand size values out of the "study" population counts. A portion of the Hand Size data table is below with how that looks:
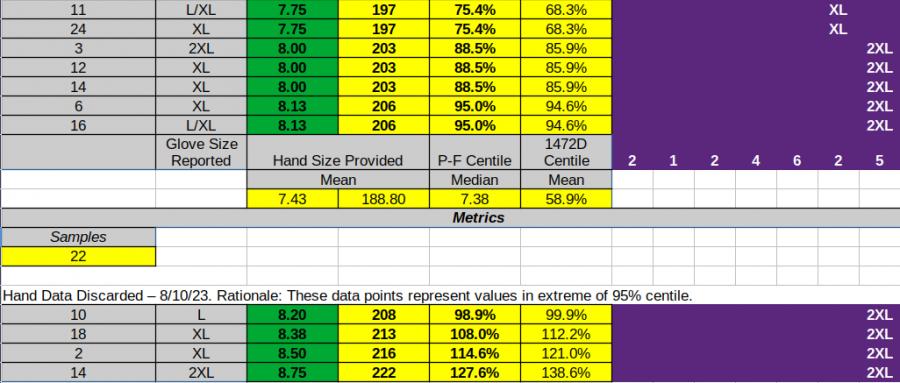
To me what's interesting is that now, the study population and the MIL-STD-1472D population are MUCH closer matched in terms of the 95% centile subjects. I take this to mean the new subset (22 vs. 26) of data more closely resembles gen pop 5 to 95% centile.
Now let's go look at the new metrics, using this data:
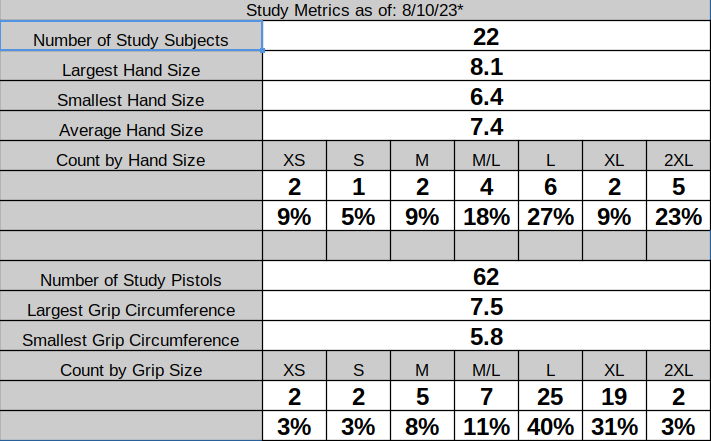
I think I can convince myself that the Hand Sizes with this new assumption better reflects typical US Glove Size sales, in that now we are talking 27% are Size L (45% if you lump in M/L), and only 9% are M. I am going to continue to ponder this but I think this makes more sense to me than what I had. Even so, we do seem to have a lot of folks with large hands on this forum.
If anyone is wondering why the grip size percentage changes, it's that the Study Spreadsheet is all computationally driven now, so it recalculates every cell as anything changes. Assumptions remain the same, but all the linear interpolations are automatically regenerated.


 Reply With Quote


